
Johns Island Q2 2026 Housing Market Report
The second quarter of 2026 delivered Johns Island's most active period on record for residential transaction volume — 237 closed residential sales and 28 vacant land closings — across a market that continues to attract buyers at nearly every price point, from $250,000 to $5,500,000.
Detached home closings alone reached 200 in a single quarter, a volume figure that reflects both the depth of buyer demand and the breadth of inventory that Johns Island offers relative to its gated island neighbors.
The attached segment recorded its strongest sold-to-list ratios of any quarter in the dataset, and land activity remained meaningful despite a wide range in absorption timelines.
As in every prior quarter, the defining variable in seller outcomes was pricing strategy at launch. Buyers across all segments are active, informed, and moving quickly on accurately priced inventory — and demonstrably more patient with listings that are not.
For more Johns Island housing market reports, visit our Johns Island Market Reports hub.
Q2 2026 Johns Island Market Overview
From April 1 through June 30, 2026, Johns Island recorded 237 residential closings and 28 vacant land closings across all property types — the highest quarterly transaction count in the current reporting period.
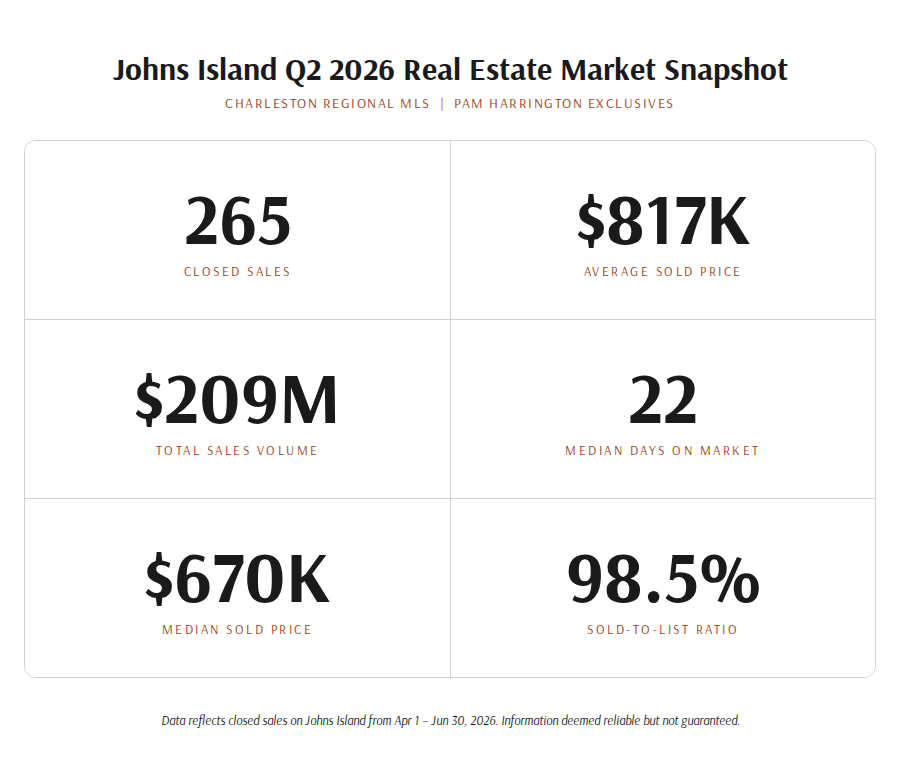
Q2 2026 Quick Market Stats (Johns Island)
All Property Types:
- Total Closed Transactions: 265
- Total Residential Closings: 237
- 200 Single-Family Homes (Detached)
- 37 Single-Family Attached Homes
- Vacant Land Closings: 28
Total Sales Volume:
- Single-Family Homes Volume: $174,919,682
- Single-Family Attached Volume: $18,740,937
- Total Residential Volume: $193,660,619
- Vacant Land Volume: $14,850,905
- Total Q2 2026 Market Volume: $208,511,524
Pricing Overview:
- Detached Median Sold Price: $724,970
- Attached Median Sold Price: $449,900
- Land Median Sold Price: $420,000
- Overall Detached Average Sold-to-List Ratio: 98.41%
- 52% of Detached Homes Sold Within 30 Days
Source: Charleston Regional MLS. Information deemed reliable but not guaranteed.
Single-Family Homes (Detached) – Q2 2026
200 Closed Sales | $174,919,682 in Volume
Pricing:
- Average Sold Price: $874,598
- Median Sold Price: $724,970
- Price Range: $320,000 – $5,500,000
- Average List Price per Sq. Ft.: $351
- Average Sold Price per Sq. Ft.: $343
- Average Sold-to-List Ratio: 98.41%
- Average Sold-to-Original-List Ratio: 96.35%
- Median Price Change from Original List: -$25,000 (-3.52%)
Property Profile:
- Average Bedrooms: 3.7
- Average Bathrooms: 2.9
- Average Square Footage: 2,496 sq. ft.
- Median Square Footage: 2,464 sq. ft.
Market Pace:
- Median Days on Market: 22 days
- Average Days on Market: 46 days
- Average Cumulative Days on Market: 57 days
- 51.50% sold within 30 days
- 10.50% required 121+ days
With 200 closed sales, the Johns Island detached segment posted its strongest single-quarter transaction count in the current dataset — a 36% increase over Q1's 147 closings.
The depth of this market across price points, from $320,000 to $5,500,000, reflects a buyer profile that spans first-time buyers, move-up buyers, and second-home purchasers in a way that few comparable markets in the Charleston area can match.
More than half of all detached closings occurred within 30 days, with those early-market sellers averaging a sold-to-original-list ratio of 98.64% — just fractions below full asking price. The median days on market of 22 days underscores how quickly well-priced inventory is moving.
Properties requiring 121 or more days averaged a sold-to-original-list ratio of 88.86%, a nearly 10-point gap from early-market performance that compounds with each additional week of market time.
The median price change of -$25,000 (-3.52%) is modest by any measure, reflecting a market in which sellers who priced accurately from the start largely avoided making meaningful concessions.
Condos and Townhomes: Single-Family Attached Homes – Q2 2026
37 Closed Sales | $18,740,937 in Volume
Pricing:
- Average Sold Price: $506,511
- Median Sold Price: $449,900
- Price Range: $250,000 – $1,365,000
- Average List Price per Sq. Ft.: $284
- Average Sold Price per Sq. Ft.: $281
- Average Sold-to-List Ratio: 98.75%
- Average Sold-to-Original-List Ratio: 97.73%
- Median Price Change from Original List: -$9,750 (-1.88%)
Property Profile:
- Average Bedrooms: 2.9
- Average Bathrooms: 2.6
- Average Square Footage: 1,782 sq. ft.
- Median Square Footage: 1,796 sq. ft.
Market Pace:
- Median Days on Market: 22 days
- Average Days on Market: 35 days
- Average Cumulative Days on Market: 47 days
- 56.76% sold within 30 days
- 5.41% required 121+ days
The attached segment delivered Q2's most precise pricing performance among property types. A sold-to-list ratio of 98.75% and a sold-to-original-list ratio of 97.73% — combined with a median price change of just -$9,750 — reflect a segment where buyers are competing for accurately priced inventory and sellers are capturing nearly full value.
More than half of all closings occurred within the first 30 days, with those early-market transactions averaging a sold-to-original-list ratio of 99.16%.
Critically, even properties that required extended market time held their pricing integrity unusually well — those on the market for 121+ days still averaged a sold-to-original-list ratio of 96.28%, a figure that stands in contrast to the steeper erosion seen in the detached and land segments for extended listings.
The top sale closed at $1,365,000. The median DOM of 22 days — matching the detached segment — confirms that mid-range attached inventory on Johns Island is moving with the same urgency as single-family homes.
Vacant Land – Q2 2026
28 Closed Sales | $14,850,905 in Volume
Pricing:
- Average Sold Price: $530,389
- Median Sold Price: $420,000
- Price Range: $200,000 – $1,950,000
- Average Sold-to-List Ratio: 93.14%
- Average Sold-to-Original-List Ratio: 91.77%
- Median Price Change from Original List: -$22,500 (-3.47%)
Market Pace:
- Median Days on Market: 14 days
- Average Days on Market: 99 days
- 53.57% sold within 30 days
- 17.86% required 121+ days
Johns Island vacant land produced 28 closings in Q2 — a 27% increase over Q1's 22. More than half of all parcels closed within the first 30 days, and a median days-on-market of just 14 days reflects genuine buyer urgency for accurately priced, well-positioned land.
The average DOM of 99 days tells a different story: a subset of parcels — including at least one that accumulated nearly 800 days on market before closing — pulled the average well beyond the median.
This divergence is the defining characteristic of the Johns Island land segment: correctly priced land sells faster than any other property type; incorrectly priced land sits on the market longer than any other.
Properties requiring 121+ days averaged a sold-to-original-list ratio of 75.20% — by far the steepest discount of any segment in Q2, and a clear illustration of the cost of entering the market above buyer expectations.
The top parcel closed at $1,950,000. Land buyers with patience and a tolerance for negotiation continue to find opportunity in the extended-market inventory; land sellers who price accurately from day one face no such wait.
Pricing Trends: Values Remain Strong
Johns Island's pricing power carried through Q2 2026, with buyers continuing to compete for accurately priced inventory at every price point.
- The detached median sold price reached $724,970, reflecting continued depth of buyer demand across the island.
- Average detached pricing exceeded $874,000, driven in part by higher-end sales — with the top transaction closing at $5,500,000.
- The attached segment held firm at a median of $449,900, providing an accessible entry point into the Johns Island market.
- Detached homes sold at an average of 98.41% of list price; the attached segment posted the strongest sold-to-list ratio of any property type at 98.75%.
The gap between early-market and extended-market outcomes remained the clearest signal in the data — pricing strategy, not market conditions, continued to separate strong results from soft ones.
Market Pace: Days on Market Breakdown
Johns Island's summer selling season moved at a brisk clip, with more than half of both detached and attached inventory finding buyers within the first month.
- Over half of detached homes (51.50%) sold within 30 days
- More than half of attached closings (56.76%) occurred within 30 days
- Detached homes taking longer than 120 days accounted for just 10.50% of sales
A median days-on-market of just 22 days for detached homes, paired with a 98.64% sold-to-original-list ratio for that early-market group, confirms that well-prepared, accurately priced listings continued to move quickly and cleanly through Q2.
Q2 2026 Takeaways
- 237 residential closings and 28 land closings produced $208,511,524 in total Q2 market volume — the highest single-quarter volume and transaction count in the current reporting period.
- Detached home closings reached 200 — a 36% increase over Q1 — with a median sold price of $724,970 and a top sale of $5,500,000.
- The attached segment recorded the strongest pricing performance of any segment in Q2, with a 98.75% average sold-to-list ratio, a median price change of just -$9,750, and only 5.41% of closings requiring 121+ days.
- Early-market detached sellers averaged a sold-to-original-list ratio of 98.64%; those requiring 121+ days averaged 88.86%.
- Land recorded the widest absorption divergence — a 14-day median DOM against a 99-day average, with 121+ day parcels averaging 75.20% of the original list.
- The price range across all residential types extended from $250,000 to $5,500,000, reflecting Johns Island's continued appeal to buyers across multiple market segments.
- Total Q2 volume of $208.5 million establishes a new high-water mark for this market in the current dataset.
Buyer & Seller Takeaways – Johns Island Q2 2026
What This Means for Johns Island Buyers
- Q2 2026 was one of the most active and competitive buying environments Johns Island has seen in the current reporting period.
- In the attached segment, more than half of the closings occurred within 30 days, and prices remained within 1–2% of asking throughout the quarter. Buyers who hesitated on well-priced mid-range inventory often missed their window.
- The detached market was similarly active in the first 30 days, though the 10.50% of listings that required 121+ days offered meaningful room for negotiation at an average of 88.86% of original list.
- Land presented the widest range of outcomes: buyers who identified accurately priced parcels moved in under two weeks; those who targeted extended-market inventory found the most negotiating leverage of any segment, with some closings occurring well below original list.
What This Means for Johns Island Sellers
- The Q2 data confirms that Johns Island is a seller's market for correctly priced properties and a buyer's market for everything else.
- The attached segment is the clearest illustration: a sold-to-original-list ratio of 97.73% with a median price change of -$9,750 reflects sellers who entered the market accurately and captured nearly full value without extended exposure.
- In the detached segment, the gap between 30-day sellers (98.64% SP/OLP) and 121+ day sellers (88.86% SP/OLP) represent a meaningful dollar difference at every price point — and a reminder that overpricing at launch costs more than the initial reduction alone.
- For land sellers, the urgency is even greater: no segment in this quarter showed a steeper penalty for extended market time. Pricing accuracy from day one is not a strategy — it is the strategy.
Q2 2026 Johns Island Market – Bottom Line
Johns Island recorded its most active quarter in the current reporting period — 265 total closings and $208.5 million in combined volume across all property types. Detached home volume dominated at nearly $175 million, the attached segment delivered the tightest pricing performance of any property type this quarter, and land activity increased meaningfully from Q1.
The market is broad, deep, and active across every price tier. Buyers are engaged and moving quickly on accurately priced inventory. The gap between well-positioned listings and overpriced ones is measurable, consistent, and growing with each quarter of data.
For more quarterly housing data, visit our Johns Island housing market reports hub.
Ready to take the next step? View all Johns Island homes for sale.
Get a Personalized Johns Island Market Analysis
Q2 2026 sets a new benchmark for this market. Whether you're planning to list this summer, evaluating a purchase, or tracking your property's value heading into the second half of the year, a personalized Johns Island market analysis from Pam Harrington Exclusives gives you the neighborhood-level context your decision requires.
👉 Request Custom Market Report
Thinking of Selling on Johns Island?
Market performance varies significantly by neighborhood, price point, and property type. With deep knowledge of Johns Island's communities — from Briars Creek and Kiawah River Estates to Haven Estates and new construction corridors along Betsy Kerrison Parkway — Pam Harrington Exclusives brings local expertise and a proven record of results to every transaction.
Schedule a Listing Consultation
Speak with a Johns Island Specialist
Contact Pam Harrington Exclusives directly for trusted guidance and market insight.
📞 (843) 768-3635
🌐 pamharringtonexclusives.com
Additional Resources
- Discover the Lifestyle of Johns Island
- What to Look for When Buying a Second Home in the Lowcountry
- Top Johns Island Real Estate Agents
- Everything You Need to Know About South Carolina Property Taxes
- Buying New Construction on Johns Island? Use a Realtor
- What You Need to Know About Johns Island, SC
- Briar’s Creek Living – Your FAQ’s Answered!
- Public Golf Courses Nearby
- New MUSC Medical Pavilion – Emergency & Primary Care
- 5 of the Most Unique Johns Island Restaurants to Try Soon
- South Island Market on Johns Island Slated to Open in 2027
- Everything You Need to Know about Rosebank Farms on Johns Island
- Freshfields Village: Johns Island’s Best Kept Secret
- Charleston Farmers Markets You Must Visit
- Retire in South Carolina: The Ultimate Guide