
Johns Island Q3 2026 Housing Market Report
The third quarter of 2026 brought seasonal cooling in volume on Johns Island, but prices held firm. Residential closings eased to 196 from 237 in Q2, and total market volume settled at $179.8 million. The detached median sold price held at $712,000, within 2% of Q2, and townhomes and condos were essentially unchanged at $450,000.
The attached segment was the quarter's standout. More than 62% of townhome and condo sales closed within 30 days, at an average of 99.24% of list price — much of it driven by new-construction inventory.
The pattern that has defined this market held once again: pricing discipline from launch remains the single most predictive factor in seller outcomes. For more Johns Island housing market reports, visit our Johns Island Market Reports hub.
Q3 2026 Johns Island Market Overview
From July 1, 2026, through September 30, 2026, Johns Island recorded 222 closed transactions across single-family homes, townhomes, condos, and land.
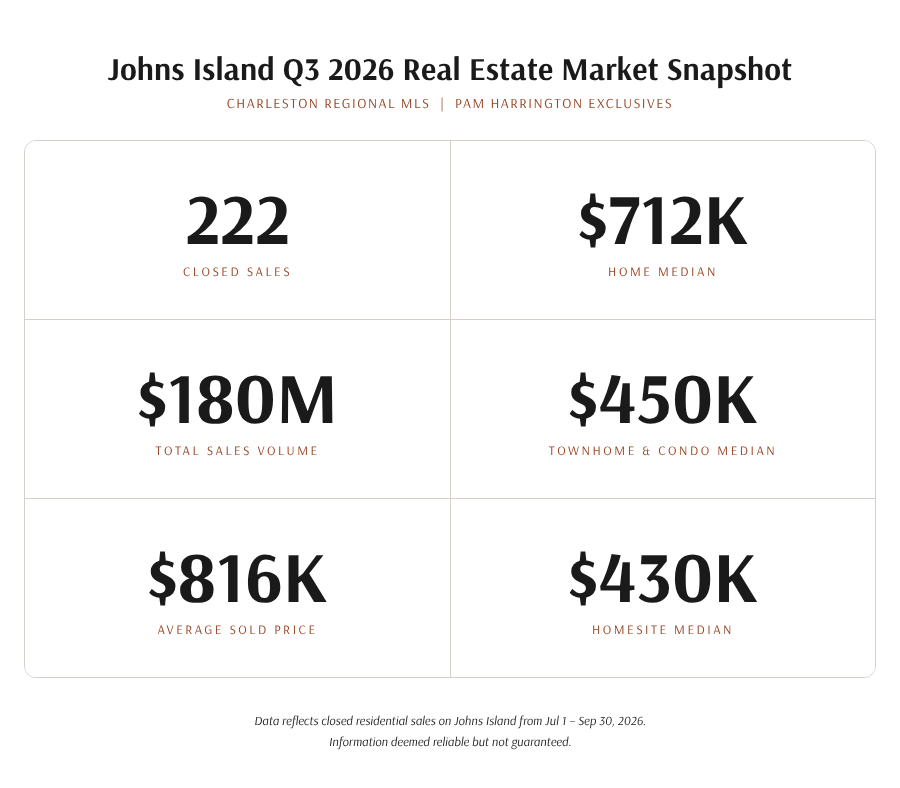
Q3 2026 Snapshot
All Property Types:
- Total Closed Transactions: 222
- Total Residential Closings: 196
-
- 159 Single-Family Homes (Detached)
- 37 Townhomes & Condos (Single-Family Attached)
- Vacant Land Closings: 26
- Single-Family Homes Volume: $142,423,427
- Townhomes & Condos Volume: $17,542,020
- Total Residential Volume: $159,965,447
- Vacant Land Volume: $19,831,500
- Total Q3 2026 Market Volume: $179,796,947
Pricing Overview:
- Detached Median Sold Price: $712,000
- Attached Median Sold Price: $450,000
- Land Median Sold Price: $430,000
- Overall Residential Average Sold-to-List Ratio: 98.15%
- 49% of Residential Properties Sold Within 30 Days
Source: Charleston Regional MLS. Information deemed reliable but not guaranteed.
Single-Family Homes (Detached) – Q3 2026
159 Closed Sales | $142,423,427 in Volume
Pricing:
- Average Sold Price: $895,745
- Median Sold Price: $712,000
- Price Range: $200,000 – $4,860,760
- Average List Price per Sq. Ft.: $364
- Average Sold Price per Sq. Ft.: $356
- Average Sold-to-List Ratio: 97.89%
- Average Sold-to-Original-List Ratio: 96.05%
- Median Price Change from Original List: -$16,300 (-2.47%)
Property Profile:
- Average Bedrooms: 3.6
- Average Bathrooms: 2.9
- Average Square Footage: 2,420 sq. ft.
- Median Square Footage: 2,435 sq. ft.
Market Pace:
- Median Days on Market: 34 days
- Average Days on Market: 48 days
- 45.91% sold within 30 days
- 9.43% required 121+ days
Detached homes accounted for 89% of total residential dollar volume in Q3, continuing to drive the Johns Island market. The median sold price of $712,000 was within 2% of Q2's $724,970, suggesting stable pricing despite fewer closings.
The $500,000 to $750,000 range was the market's center of gravity, with 59 sales — 37% of all detached closings. At the upper end, 38 homes sold for $1,000,000 or more, producing $67.7 million, or 47% of detached volume. Kiawah River led the luxury tier with 12 closings at a $1,550,000 median, including the quarter's top sale of $4,860,760.
Properties that launched accurately and sold within the first 30 days averaged a sold-to-original-list ratio of 98.30%. Eighteen homes closed above their list price.
Properties requiring 121 or more days averaged 92.29% of original list — a 6-point gap from early-market performance. Only 9% of detached homes fell into that group, but price reductions and carrying costs added up for those that did.
The median price change of -$16,300 (-2.47%) from the original list price shows a market where most well-priced sellers needed only modest adjustments.
Townhomes & Condos (Single-Family Attached) – Q3 2026
37 Closed Sales | $17,542,020 in Volume
Pricing:
- Average Sold Price: $474,109
- Median Sold Price: $450,000
- Price Range: $312,000 – $780,000
- Average List Price per Sq. Ft.: $271
- Average Sold Price per Sq. Ft.: $268
- Average Sold-to-List Ratio: 99.24%
- Average Sold-to-Original-List Ratio: 99.61%
- Median Price Change from Original List: -$3,000 (-0.95%)
Property Profile:
- Average Bedrooms: 3.0
- Average Bathrooms: 2.7
- Average Square Footage: 1,830 sq. ft.
- Median Square Footage: 1,995 sq. ft.
Market Pace:
- Median Days on Market: 25 days
- Average Days on Market: 48 days
- 62.16% sold within 30 days
- 10.81% required 121+ days
Townhomes and condos recorded the strongest early-absorption rate of any property type in Q3, with 62% of closings occurring within the first 30 days — up from 57% in Q2. Closings held steady at 37, and the median sold price remained unchanged at $450,000 from Q2.
New construction shaped this segment. Twenty-seven of the 37 attached homes sold were built in 2025 or 2026, led by Indigo Hall at Hope Plantation (9 sales) and Indigo Grove (8 sales). The top sale closed in Hayes Park for $780,000.
Properties selling within 30 days averaged a sold-to-original-list ratio of 101.52%, and 19 of the 37 sales closed at their full list price. The four homes that required 121 or more days averaged 94.56% — a 7-point gap that shows how quickly leverage shifts once a listing lingers.
The median price change of just -$3,000 (-0.95%) makes this the most price-stable segment on the island this quarter.
Johns Island Vacant Land Sales – Q3 2026
26 Closed Sales | $19,831,500 in Volume
Pricing:
- Average Sold Price: $762,750
- Median Sold Price: $430,000
- Price Range: $80,000 – $5,000,000
- Average Sold-to-List Ratio: 95.32%
- Average Sold-to-Original-List Ratio: 93.06%
- Median Price Change from Original List: -$17,500 (-3.05%)
Market Pace:
- Median Days on Market: 24.5 days
- Average Days on Market: 122 days
- 50.00% sold within 30 days
- 34.62% required 121+ days
Land volume rose 34% from Q2 to $19.8 million on 26 closings, lifted by two large-acreage sales on Humbert Road at $4,475,000 (about 120 acres) and $5,000,000 (about 103 acres). Together, those two transactions made up 48% of the quarter's land volume.
The median sold price was $430,000, up 2.4% from Q2. Waterfront and amenity-community homesites set the upper range, including a Kiawah River homesite that closed at its full $850,000 list price and a Bohicket Creek waterfront parcel at $752,000.
Land remains the most divided segment on the island. Half of all parcels sold within 30 days at an average of 97.19% of original list. The 34.62% that required 121 or more days averaged 89.53% — and one 14-acre tract took more than three years to close. The average DOM of 122 days reflects those long-tail parcels, not the typical sale.
Johns Island Q3 2026 Real Estate Takeaways
- 196 residential closings and 26 land closings produced $179,796,947 in total Q3 market volume — a seasonal step down from Q2's $208.5 million.
- The detached median sale price held at $712,000, within 2% of Q2, with a top sale of $4,860,760 in Kiawah River.
- 38 detached homes sold for $1,000,000 or more, producing $67.7 million — 47% of detached volume.
- Townhomes and condos recorded the highest early-absorption rate of Q3, with 62.16% of closings occurring within 30 days and an average sold-to-list ratio of 99.24%.
- Early-market detached sellers (0–30 days) averaged a sold-to-original-list ratio of 98.30%; those requiring 121+ days averaged 92.29% — a 6-point gap.
- Early-market townhome and condo sellers averaged 101.52% of original list; those requiring 121+ days averaged 94.56%.
- Vacant land volume rose 34% to $19.8 million, though parcels requiring 121+ days averaged just 89.53% of original list.
- Residential prices ranged from $200,000 to $4,860,760, reflecting broad participation across buyer profiles.
Q3 2026 offered entry points across a wide price range — from $312,000 to $780,000 in the townhome and condo segment, and $200,000 to $4,860,760 for detached homes. Patient buyers found opportunities in properties with extended market times, where sold-to-original-list ratios averaged the low 90s.
Buyers prepared to act quickly on accurately priced inventory — particularly in the townhome and condo segment — needed to move with conviction, as nearly two-thirds of attached closings occurred within the first 30 days.
-
What This Means for Buyers:
Q3 2026 rewarded preparation. In the townhome and condo segment, 62% of closings occurred within 30 days, and early sales averaged above original list price. Buyers who hesitated on well-priced inventory often missed out.
In the detached segment, the first month on market remained the most competitive window, with early sellers averaging 98.30% of the original list price. Flexible buyers found more room to negotiate on homes that lingered, where sold-to-original-list ratios averaged 92.29% after 121 or more days.
The land segment offered the widest range of outcomes. Parcel-level evaluation — access, utilities, flood zone, and buildable area — matters more than any island-wide average.
-
What This Means for Sellers:
Summer 2026 confirmed what the data has shown consistently: the Johns Island housing market is active, and buyer demand is real, but buyers are informed and selective.
The reward for accurate pricing from launch — in speed, in final sale price, and in overall outcome — is clearly measurable. Detached sellers who priced correctly closed within 30 days at 98.30% of the original list price.
Those who did not averaged 92.29% after 121+ days. The townhome and condo segment tells the same story, and land shows it most sharply. As the market moves into fall and winter, pricing strategy remains the highest-leverage decision.
Q3 2026 – Bottom Line
Johns Island's third quarter of 2026 saw a seasonal volume slowdown, with pricing holding firm—196 residential closings, $179.8 million in total volume, and a detached median price of $712,000, within 2% of Q2.
Townhomes and condos absorbed faster than any other segment, with 62% selling in the first 30 days at near full price. Vacant land volume rose 34%, led by two large-acreage transactions.
The market is healthy, buyer demand is genuine, and the gap between well-positioned inventory and overpriced listings continues to show up in every quarter of data.
For more quarterly housing data, visit our Johns Island housing market trends hub.
Ready to take the next step? View all Johns Island homes for sale.
Request a Johns Island Market Analysis
Q3 2026 sets the stage for the year's final quarter. Whether you're planning to list this fall, evaluating a purchase, or tracking your property's value, a personalized Johns Island market analysis from Pam Harrington Exclusives gives you the specific context your decision requires.
Thinking of Selling on Johns Island?
Understanding pricing trends is critical to successfully selling on Johns Island. With decades of local expertise and a proven track record, Pam Harrington Exclusives delivers strategic positioning, global digital exposure, and exceptional service from consultation to closing.
Speak with a Johns Island Specialist
Contact Pam Harrington Exclusives directly for trusted guidance and market insight.
(843) 768-3635
Additional Resources
- Discover the Lifestyle of Johns Island
- What to Look for When Buying a Second Home in the Lowcountry
- Top Johns Island Real Estate Agents
- Everything You Need to Know About South Carolina Property Taxes
- Buying New Construction on Johns Island? Use a Realtor
- What You Need to Know About Johns Island, SC
- Briar’s Creek Living – Your FAQ’s Answered!
- Public Golf Courses Nearby
- New MUSC Medical Pavilion – Emergency & Primary Care
- 5 of the Most Unique Johns Island Restaurants to Try Soon
- South Island Market on Johns Island Slated to Open in 2027
- Everything You Need to Know about Rosebank Farms on Johns Island
- Freshfields Village: Johns Island’s Best Kept Secret
- Charleston Farmers Markets You Must Visit
- Retire in South Carolina: The Ultimate Guide