
Seabrook Island Q2 2026 Housing Market Report
The second quarter of 2026 brought a meaningful surge in activity across Seabrook Island, with total residential closings rising to 56 — a 37% increase over Q1's 41. Spring demand proved real and broad-based, with detached homes delivering strong luxury-tier performance and villas and cottages recording the highest early-absorption rate of any segment this quarter.
Accurately priced properties found buyers quickly; properties that entered the market above buyer expectations faced extended timelines and measurable price erosion.
The pattern that has defined this market across ten consecutive quarters of data held: pricing discipline from launch remains the single most predictive factor in seller outcomes. For more Seabrook Island housing market reports, visit our Seabrook Island Market Reports hub.
Q2 2026 Seabrook Island Market Overview
From April 1, 2026, through June 30, 2026, Seabrook Island recorded measured activity across homes, villas, and land.
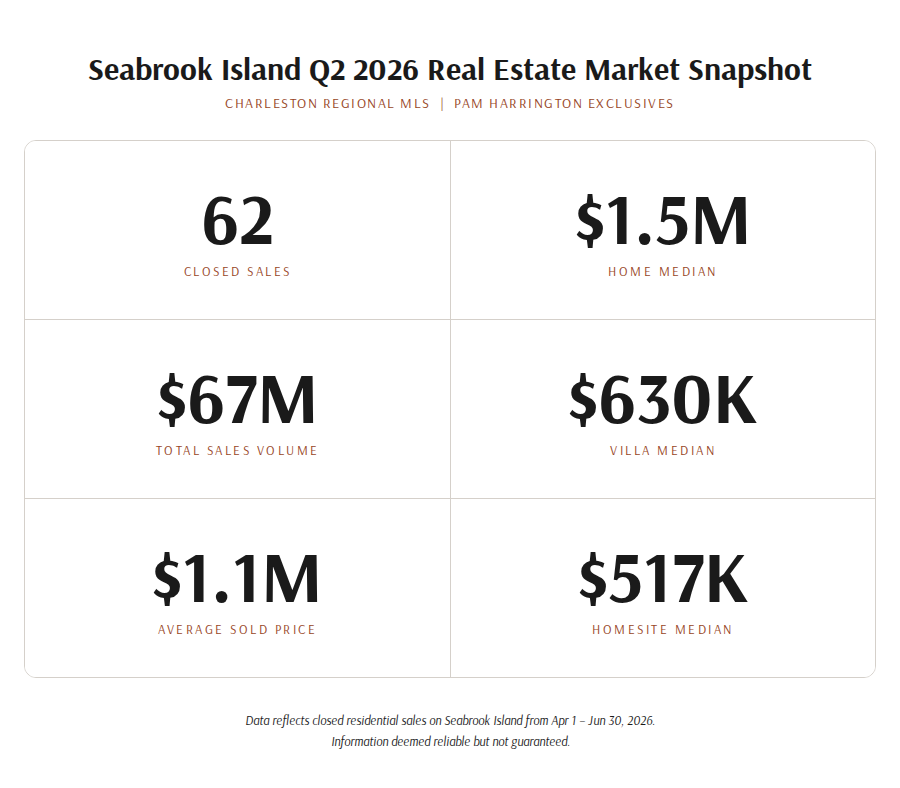
Q2 2026 Snapshot
All Property Types:
- Total Closed Transactions: 62
- Total Residential Closings: 56
- 27 Single-Family Homes (Detached)
- 29 Villas & Cottages (Single-Family Attached)
- Vacant Land Closings: 6
- Single-Family Homes Volume: $44,372,050
- Villas & Cottages Volume: $19,490,000
- Total Residential Volume: $63,862,050
- Vacant Land Volume: $3,261,360
- Total Q2 2026 Market Volume: $67,123,410
Pricing Overview:
- Detached Median Sold Price: $1,545,000
- Attached Median Sold Price: $630,000
- Land Median Sold Price: $516,680
- Overall Residential Average Sold-to-List Ratio: 96.55%
- 47% of Residential Properties Sold Within 30 Days
Source: Charleston Regional MLS. Information deemed reliable but not guaranteed.
Single-Family Homes (Detached) – Q2 2026
27 Closed Sales | $44,372,050 in Volume
Pricing:
- Average Sold Price: $1,643,409
- Median Sold Price: $1,545,000
- Price Range: $442,000 – $4,350,000
- Average List Price per Sq. Ft.: $656
- Average Sold Price per Sq. Ft.: $628
- Average Sold-to-List Ratio: 96.19%
- Average Sold-to-Original-List Ratio: 93.60%
- Median Price Change from Original List: -$122,500 (-6.55%)
Property Profile:
- Average Bedrooms: 3.2
- Average Bathrooms: 3.2
- Average Square Footage: 2,539 sq. ft.
- Median Square Footage: 2,802 sq. ft.
Market Pace:
- Median Days on Market: 22 days
- Average Days on Market: 77 days
- Average Cumulative Days on Market: 85 days
- 40.74% sold within 30 days
- 22.22% required 121+ days
Detached homes accounted for 69% of total residential dollar volume in Q2 — consistent with their role as the primary driver of Seabrook Island's overall market performance. The median sold price of $1,545,000 and top sale of $4,350,000 reflect continued strength at the luxury tier. Properties that launched accurately and sold within the first 30 days averaged a sold-to-original-list ratio of 97.79%, closing efficiently and cleanly.
The median days-on-market of just 22 days for those early-market transactions underscores how quickly prepared buyers are acting on well-positioned inventory.
Properties requiring 121 or more days averaged a sold-to-original-list ratio of 84.83% — a 13-point gap from early-market performance that reflects the compounding cost of overpricing: price reductions, extended carrying costs, and diminished buyer confidence all contribute to that erosion.
The median price change of -$122,500 from the original list price is a clear signal that the market is setting its own level, regardless of where sellers begin.
Villas & Cottages (Single-Family Attached) – Q2 2026
29 Closed Sales | $19,490,000 in Volume
Pricing:
- Average Sold Price: $672,068
- Median Sold Price: $630,000
- Price Range: $275,000 – $1,400,000
- Average List Price per Sq. Ft.: $568
- Average Sold Price per Sq. Ft.: $550
- Average Sold-to-List Ratio: 96.94%
- Average Sold-to-Original-List Ratio: 94.24%
- Median Price Change from Original List: -$30,000 (-6.54%)
Property Profile:
- Average Bedrooms: 1.9
- Average Bathrooms: 2.1
- Average Square Footage: 1,223 sq. ft.
- Median Square Footage: 1,114 sq. ft.
Market Pace:
- Median Days on Market: 27 days
- Average Days on Market: 99 days
- Average Cumulative Days on Market: 128 days
- 51.72% sold within 30 days
- 27.59% required 121+ days
Villas and cottages recorded the strongest early-absorption rate of any property type in Q2, with more than half of all closings occurring within the first 30 days. The top sale closed above list price at $1,400,000 — one of several attached transactions that reflected genuine buyer competition on accurately priced inventory.
The median DOM of 27 days tells a clear story about the segment's demand at the mid-range price point: buyers are engaged, informed, and prepared to move. The average DOM of 99 days, however, reflects a segment with notable divergence between fast-moving inventory and a meaningful share — 27.59% — that required 121 or more days to close.
Properties in that extended-market group averaged a sold-to-original-list ratio of 87.85%, compared to 97.53% for those selling within 30 days — a 10-point gap that underscores the importance of entering the market at the right price from the start. The median price change of -$30,000 (-6.54%) is modest in dollar terms but consistent in direction.
Vacant Land – Q2 2026
6 Closed Sales | $3,261,360 in Volume
Pricing:
- Average Sold Price: $543,560
- Median Sold Price: $516,680
- Price Range: $399,000 – $749,000
- Average Sold-to-List Ratio: 96.42%
- Average Sold-to-Original-List Ratio: 96.42%
- Price Change from Original List: None — no parcel required a price reduction.
Market Pace:
- Median Days on Market: 21.5 days
- Average Days on Market: 49 days
- 33.33% sold within 30 days
- 16.67% required 121+ days
Land activity tripled from Q1's 2 closings to 6 in Q2, reflecting strengthened buyer interest in Seabrook Island homesites as the spring season brought more buyers to the market.
Notably, not a single parcel required a price reduction — all six closed at or within a narrow range of the original list price, with an average sold-to-original-list ratio of 96.42%.
The top lot closed at the full list price of $749,000. The median days on market of 21.5 days places Seabrook Island land among the more efficiently absorbed segments this quarter, though the average DOM of 49 days reflects one outlier parcel that required 187 days before closing — a reminder that land remains a patient buyer's market for parcels that aren't well-positioned from the start.
Q2 2026 Takeaways
- 56 residential closings and 6 land closings produced $67,123,410 in total Q2 market volume — the strongest quarter by volume since Q2 2025.
- Detached homes accounted for 69% of residential dollar volume, with a median sale price of $1,545,000 and a top sale of $4,350,000.
- The villa and cottage segment recorded the highest early-absorption rate of Q2, with 51.72% of closings occurring within 30 days, and one transaction closing above list price.
- Early-market detached sellers (0–30 days) averaged a sold-to-original-list ratio of 97.79%; those requiring 121+ days averaged 84.83% — a 13-point gap.
- Early-market villa sellers averaged 97.53% of the original list; those requiring 121+ days averaged 87.85% — consistent with the pattern across all prior quarters.
- Vacant land produced 6 clean closings with no price reductions and a 96.42% average sold-to-original-list ratio.
- The top sale across all residential types reached $4,350,000; the price range extended from $275,000 to $4,350,000, reflecting broad market participation across buyer profiles.
Q2 2026 offered entry points across a wide price range — from $300,000 in the villa segment to $3,250,000 at the top of the attached market, and $695,000 to $3,000,000 for detached homes. Buyers with patience found opportunities in properties with extended market times, where sold-to-original-list ratios averaged in the high-80s to low-90s.
Buyers prepared to act quickly on accurately priced inventory — particularly in the villa segment — needed to move with conviction, as nearly half of attached closings occurred within the first 30 days.
-
What This Means for Buyers:
Q2 2026 was an active market that rewarded preparation. In the villa and cottage segment, more than half of all closings occurred within 30 days — buyers who hesitated on accurately priced inventory frequently missed their opportunity.
In the detached segment, the early weeks on market remained the window of highest competition, with sellers averaging close to the asking price and limited room for negotiation. Buyers with patience and flexibility found more room to negotiate on the 22–28% of listings in each segment that required extended market time, where sold-to-original-list ratios averaged in the mid-to-high 80s.
The land segment offered strong overall pricing integrity with no reductions, but the range of absorption timelines — from under 30 days to 187 days — reflects the importance of parcel-level evaluation.
-
What This Means for Sellers:
Spring 2026 confirmed what the data has shown consistently: the Seabrook Island housing market is active, and buyer engagement is real, but buyers are informed and selective.
The reward for accurate pricing from launch — in speed, in final sale price, and in overall outcome, is clearly measurable. Detached sellers who priced correctly closed in 22 days at 97.79% of original list.
Those who did not averaged 84.83% after 121+ days. The villa segment tells the same story. As summer inventory builds and more listings compete for buyer attention, the advantage of entering the market at an accurate price becomes even more pronounced.
Sellers heading into Q3 should treat pricing strategy as the highest-leverage decision in the process.
Q2 2026 – Bottom Line
Seabrook Island's second quarter of 2026 delivered the market's most active period since spring 2025 — 56 residential closings, $67 million in total volume, and strong performance across all three property types. The detached segment anchored luxury-tier demand at a $1,545,000 median.
Villas and cottages absorbed efficiently, with more than half selling in the first 30 days. Vacant land posted six clean closings with no price reductions.
The market is healthy, buyer demand is genuine, and the gap between well-positioned inventory and overpriced listings continues to widen with each quarter of data.
For more quarterly housing data, visit our Seabrook Island housing market trends hub.
Ready to take the next step? View all Seabrook Island homes for sale.
Request a Seabrook Island Market Analysis
Q2 2026 sets the pace for the second half of the year. Whether you're planning to list this summer, evaluating a purchase, or tracking your property's value, a personalized Seabrook Island market analysis from Pam Harrington Exclusives gives you the specific context your decision requires.
Thinking of Selling on Seabrook Island?
Understanding pricing trends is critical to successfully selling on Seabrook Island. With decades of Seabrook Island expertise and a proven track record, Pam Harrington Exclusives delivers strategic positioning, global digital exposure, and exceptional service from consultation to closing.
Speak with a Seabrook Island Specialist
Contact Pam Harrington Exclusives directly for trusted guidance and market insight.
Additional Resources
- Kiawah Island vs. Seabrook Island – What’s the Difference?
- Just Announced: The Inlet at Seabrook Island
- The Town of Seabrook Island – A Brief Overview
- Everything You Need to Know About the Seabrook Island Property Owners Association (SIPOA)
- Seabrook Island Dog Friendly Beaches
- 5 Reasons Pelican Watch Seabrook Island is a Great Investment
- Build Your Dream Home on Seabrook Island
- Seabrook Island Tennis
- Owning a Rental Investment Property on Kiawah and Seabrook Islands – How to Be Successful
- Summer Activities on Kiawah and Seabrook Island
- What Are the Best South Carolina Beach Towns?
- Dolphins Strand Feeding on Seabrook Island